Abstract
This tool enables performance profiling of GPU kernel code used in various HPC and AI workloads to help optimize the kernel code by providing key insights on its performance characteristics on AMD’s Data Center GPUs such as MI 100, 200, 300 and 350 series of GPUs.
It collects raw performance counters from various IP blocks of the GPU and derives performance metrics such as Speed-Of-Light metrics, wavefront occupancy, roofline (compute vs memory bound), memory hierarchy bandwidth and data transfer, GPU pipeline stalls, scheduling efficiency, instruction mix and other useful metrics. Moreover, it allows ROCtx based tracing to correlate source code with associated performance metrics. Other features include Program Counter (PC) sampling to investigate instructions stalls, roofline empirical benchmark and filtering options for fast and efficient profiling. To collect large number of raw performance counters, the tool leverages application replay and optionally provides iteration multiplexing ability to prevent application replay for large workloads with counter accuracy trade-off.
Analysis GUI
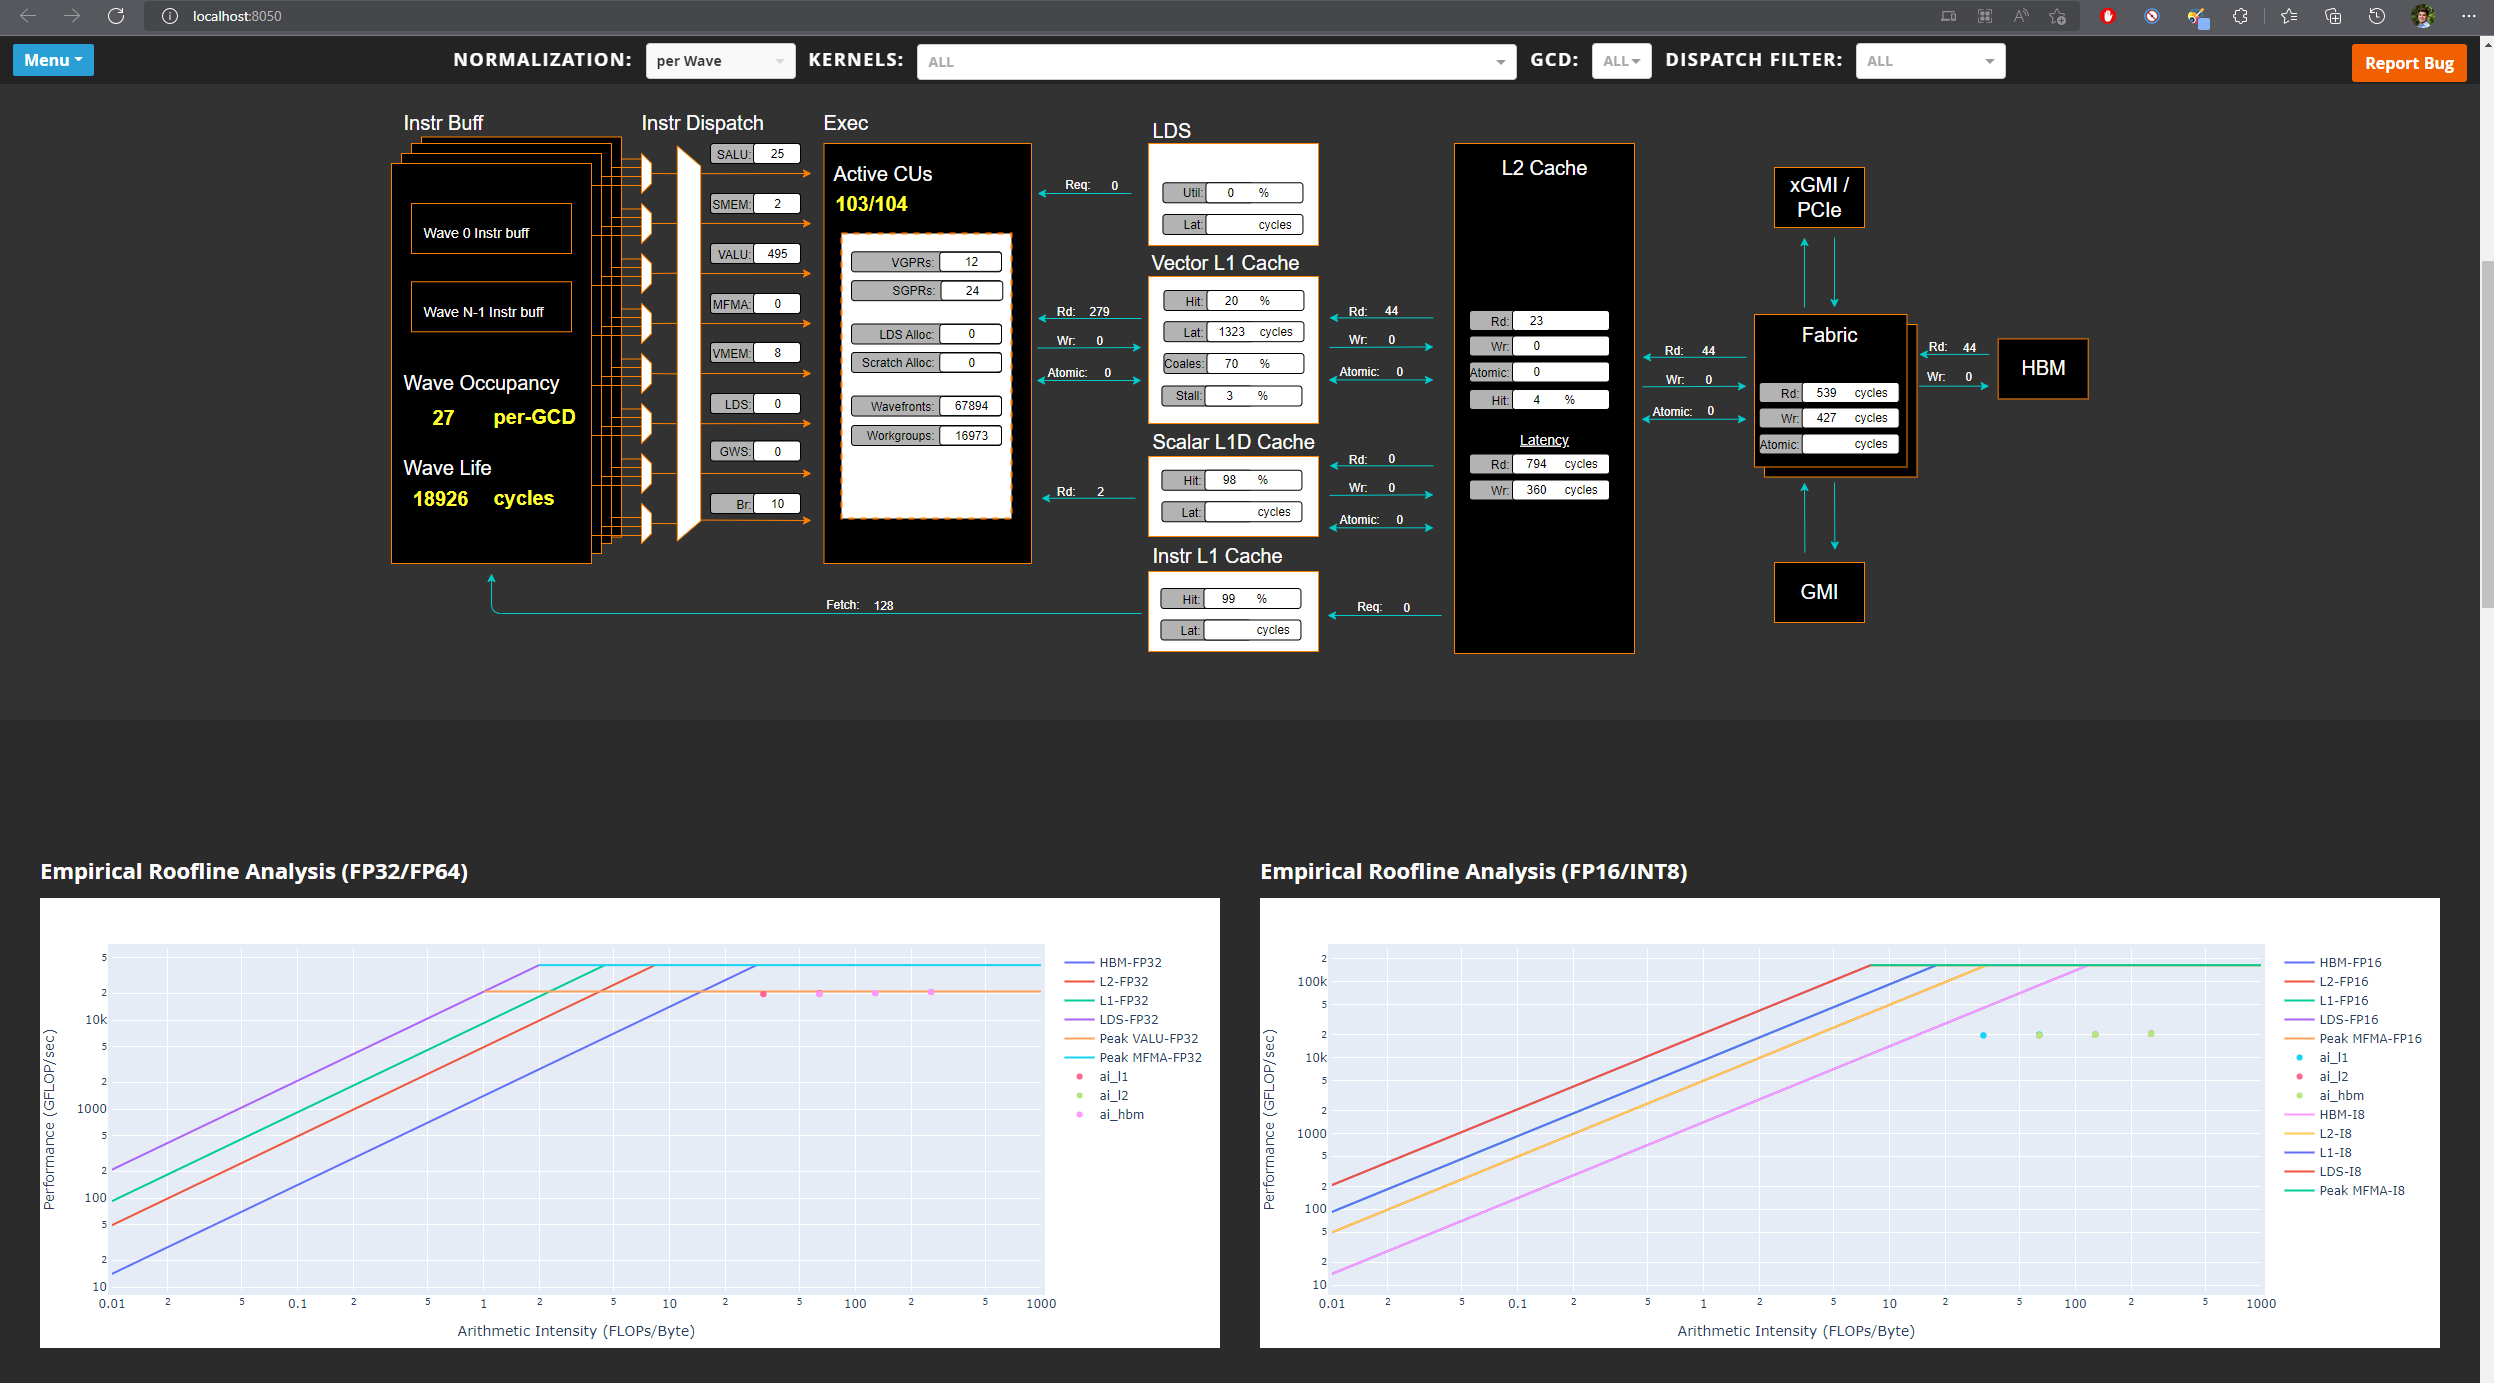
Details
As part of the profiling team, I have contributed to the following interesting features of the tool:
Counter collection service
Since rocprofiler-compute is a higher level tool written in Python, it requires interfacing with lower level C++ based tools to get access to counter collection services. I wrote a C++ library tool using API provided by rocprofiler-sdk to setup profiling configuration based on profiling filters provided by the user and then intercept relevant kernel dispatches to gather their launch parameters and register counters. The collected data is then stored in memory in structs and finally written to the disk when the workload being profiled exits. The Python tool takes care of runtime compilation of the C++ tool (if required) and sets the LD_PRELOAD environment variable such that the tool can setup the profiling services before the workload starts. This is called dynamic instrumentation.
Iteration multiplexing
Due to hardware limitation in the number of registers and their sizes on the GPU, the number of counters that can be collected per kernel dispatch is limited. This requires the application to be run multiple times depending on the number of counters required to be collected to derive the relevant performance metrics. I worked on a methodology called iteration multiplexing which splits the requested counters into buckets of counters that can be collected per kernel dispatch. For every unique kernel (based on kernel name and launch parameters) the methodology rotates through the buckets for every dispatch of that unique kernel. Since large AI/HPC workloads have large number of dispatches per unique kernel, this approach significantly cuts down the time taken for profiling while ensuring all required counters are collected. However, this comes with an accuracy trade-off where the counter data missing for a dispatch has to be interpolated based on other dispatches of the same unique kernel. I implemented a data imputation algorithm to interpolate the missing data to prevent errors in deriving performance metrics.
MI 350 support
As GPU architecture evolves and new ones are released, the profiling tools have to be updated to use architecture specific raw counters to derive existing performance metrics as well as additional metrics not possible with previous architectures. This ensures that users see accurate performance data for that architecture and obtain insights into new features. I studied the MI 350 GPU architecture to identify and understand the raw counters and then came up with arithmetic formulas to derive existing as well as new performance metrics. These metrics also had to be documented and their measurement units listed to help explain their meaning in plain english to kernel developers who might not be familiar with the GPU architecture. A basic guide on performance modelling of AMD MI series GPUs can be found here.
Analysis database
The output of the tool consists of derived metrics, empirical roofline peaks, memory hierarchy bandwidth and PC sampling data. All of this information has to be presented to the user in a structured format to help users correlated kernels and dispatches with the corresponding performance metrics. I worked on a SQL schema to organize all of this information into an analysis database which is well normalized for quick lookups. This database schema allows for efficient lookups of kernel and dispatch data and also provides views to access common analysis data without having to write complicated SQL queries. Moreover, the schema supports baseline comparison of performance metrics between different versions of a workload to understand impact on performance as the workload changes. This database can be plugged-in with downstream analysis and visualization applications and provides a quick way to share analysis data.
Docker based testing
This tool has multiple dependencies which can be tedious to setup such as rocminfo, amd-smi, rocprofiler-sdk, aqlprofile, python interpreter and third party python packages. I worked on a Dockerfile and Docker compose file to quickly spawn a container which enables an environment for profiling workloads without having to setup any dependencies manually. The container takes care of installing version specific ROCm stack for a given GPU using TheRock, Ubuntu specific packages, python interpreter and third party python dependencies for proper functioning of the tool. This makes development, testing and usage of the tool quick and easy.
Standalone binary
The tool is also available as a self extracting standalone binary for users who don’t want the hassle of maintaining python interpreter, virtual environments and python dependencies. I worked on docker files and scripts to create a standalone binary which uses Nuitka to embed the python interpreter and python dependencies into a single executable file. This makes the tool portable and easy to install on any system.
Resources
For link to documentation, click here
For link to source code, click here
Acknowledgements
All credits for this work goes to the contributors of this project [1]
References
[1] https://github.com/ROCm/rocm-systems/tree/develop/projects/rocprofiler-compute